K-means
K-meansSummaryKey TakeawaysInterview QuestionsWhat is the objective of the K-means algorithm?How does the K-means algorithm initialize the cluster centroids?How does the algorithm assign data points to clusters?What is the significance of the "k" value in K-means? How do you choose an appropriate value for "k"?How does the algorithm update the cluster centroids in each iteration?What are some common challenges or limitations of the K-means algorithm?How does K-means handle categorical or high-dimensional data?What are some techniques to improve the performance and robustness of K-means?Are there any alternatives or variations of K-means that you are familiar with?How do you evaluate the quality of the clustering results produced by K-means?Python ImplementK-means++K-MedoidsDBSCANHierarchical ClusteringFuzzy C-Means
Summary
K-means is a simple yet effective unsupervised learning algorithm that clusters data points based on their similarities, aiming to minimize intra-cluster variance while maximizing inter-cluster separation.
Key Takeaways
K-means is an iterative algorithm that partitions a dataset into k clusters based on similarities among data points.
It is an unsupervised learning algorithm, meaning it doesn't require labeled data.
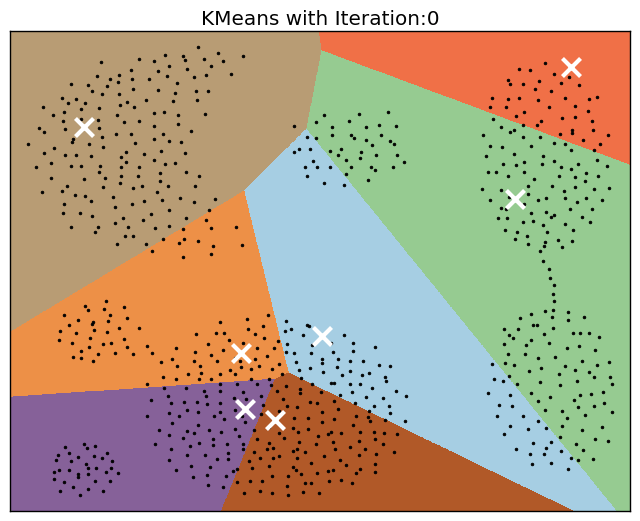
The algorithm starts by randomly initializing k cluster centroids.
It then assigns each data point to the nearest centroid, forming initial clusters.
The centroids are updated by calculating the mean of the data points within each cluster.
The process of assigning points and updating centroids iterates until convergence, when the centroids no longer change significantly.
K-means aims to minimize the sum of squared distances between data points and their respective cluster centroids.
The choice of k (the number of clusters) is typically determined beforehand or through evaluation metrics like the elbow method.
K-means can be sensitive to the initial random centroid selection, leading to different results for each run.
It works well with numerical data but may struggle with categorical or high-dimensional data, requiring preprocessing techniques like feature scaling or dimensionality reduction.
Interview Questions
What is the objective of the K-means algorithm?
The objective of the K-means algorithm is to partition a given dataset into K clusters, where K is a predetermined number. It aims to minimize the within-cluster variance or the sum of squared distances between each data point and the centroid of its assigned cluster. In simpler terms, the algorithm tries to find the best placement of K centroids so that the distances between data points and their assigned centroids are minimized.
How does the K-means algorithm initialize the cluster centroids?
Random Initialization: Initially, K data points are randomly selected from the dataset as the initial centroids.
Centroid Calculation: The algorithm calculates the centroid of each cluster by taking the mean of all the data points assigned to that cluster.
Iterative Refinement: The algorithm iteratively refines the centroids by repeating the following steps until convergence: a. Assigning each data point to the cluster with the nearest centroid. This assignment is done based on the Euclidean distance between the data point and each centroid. b. Recalculating the centroids of each cluster based on the updated assignments.
How does the algorithm assign data points to clusters?
To assign data points to clusters, the K-means algorithm follows these steps:
Initialization: Initially, the algorithm randomly assigns each data point to one of the K clusters based on the initial centroids.
Distance Calculation: For each data point, the algorithm calculates the distance to each of the K centroids using a distance metric, commonly the Euclidean distance.
Assignment: The algorithm assigns each data point to the cluster whose centroid is closest to it, using the distances calculated in the previous step.
Centroid Recalculation: After all the data points have been assigned to clusters, the algorithm recalculates the centroids of each cluster by taking the mean of all the data points assigned to that cluster.
Iterative Refinement: Steps 2-4 are repeated until convergence, which occurs when the cluster assignments no longer change significantly or a maximum number of iterations is reached.
By iteratively updating the cluster assignments and centroids, the algorithm aims to find the optimal partitioning of the data points into K clusters based on minimizing the within-cluster variance.
What is the significance of the "k" value in K-means? How do you choose an appropriate value for "k"?
The "k" value in K-means represents the number of clusters that the algorithm will attempt to create. It determines the desired number of centroids in the dataset and directly influences the partitioning of data points. The choice of "k" is crucial as it can significantly impact the results and interpretation of the algorithm.
Choosing an appropriate value for "k" can be subjective and problem-specific. Here are a few methods commonly used for determining the value of "k":
Domain Knowledge: If you have prior knowledge or understanding of the problem domain, you may have insights into the expected number of clusters. For example, in customer segmentation, you might have a good idea about the number of distinct customer groups.
Elbow Method: The elbow method is a common approach to determine the value of "k" based on the within-cluster sum of squares (WCSS) or the sum of squared distances between data points and their assigned centroids. The idea is to plot the WCSS against different values of "k" and look for an "elbow" point, where the rate of decrease in WCSS significantly diminishes. The value of "k" corresponding to the elbow point is often considered a reasonable choice.
Silhouette Coefficient(轮廓系数法): The silhouette coefficient measures the compactness of clusters and separation between clusters. It ranges from -1 to 1, where higher values indicate better-defined clusters. By calculating the silhouette coefficient for different values of "k," you can select the value that maximizes the coefficient.
轮廓系数法可以帮助确定聚类数量"k"的原因是它提供了一个对聚类结果进行量化评估的指标。通过计算每个数据点的轮廓系数,可以评估该数据点在其所属聚类中的适应度,并衡量聚类的紧密性和分离性。
在确定聚类数量时,我们希望找到一个平衡点,即聚类数量能够使得数据点在各自的聚类中具有较高的相似性(紧密性),同时不同聚类之间也具有较高的差异性(分离性)。
使用轮廓系数法时,我们计算不同聚类数量下的平均轮廓系数,然后选择具有最大平均轮廓系数的聚类数量作为最佳"k"值。较高的平均轮廓系数表示聚类结果具有较好的紧密性和分离性,而较低的平均轮廓系数则表示聚类结果可能存在较大的重叠或混淆。
因此,通过比较不同聚类数量下的轮廓系数,我们可以确定具有最佳聚类结构的聚类数量"k",以获得更有效的聚类结果。
Domain-Specific Metrics: Depending on the problem at hand, you may have specific evaluation metrics that can guide the selection of "k." For example, in image segmentation, you might consider metrics like the Rand Index or the Fowlkes-Mallows Index to assess the quality of the clustering results for different values of "k."
How does the algorithm update the cluster centroids in each iteration?
In each iteration of the K-means algorithm, the cluster centroids are updated by recalculating their positions based on the data points assigned to each cluster. Here's a simplified explanation of the process:
Initialization: Randomly select K data points as the initial cluster centroids.
Assignment: For each data point, calculate its distance to each cluster centroid and assign it to the cluster with the closest centroid.
Update centroids: For each cluster, recalculate the mean of all data points assigned to that cluster to obtain the new centroid positions.
Iterative refinement: Repeat steps 2 and 3 until the cluster assignments no longer change significantly or a maximum number of iterations is reached.
By iteratively updating the cluster centroids, the K-means algorithm seeks to find the optimal positions of the centroids that minimize the distances between data points and their assigned centroids, resulting in meaningful clusters.
What are some common challenges or limitations of the K-means algorithm?
The K-means algorithm, despite its simplicity and effectiveness in many cases, has some challenges and limitations. Here are some common ones:
Sensitivity to Initialization: K-means is sensitive to the initial placement of the cluster centroids. Depending on the initial random selection, the algorithm may converge to different solutions or get stuck in suboptimal local optima. Multiple runs with different initializations can mitigate this issue.
Determining the Number of Clusters (K): Selecting the appropriate number of clusters (K) can be challenging. There is no definitive method for determining the optimal value of K, and it often requires domain knowledge or trial-and-error approaches.
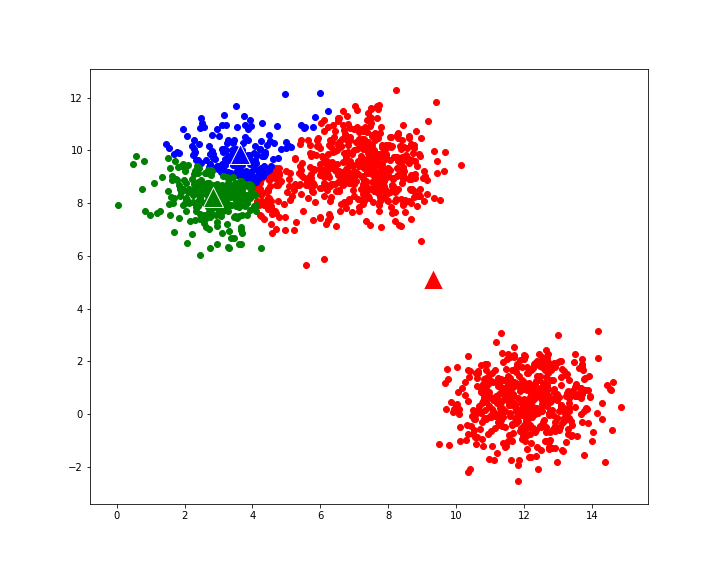
Influence of Outliers: K-means is highly sensitive to outliers, as they can significantly impact the positions of cluster centroids. Outliers may distort the cluster boundaries and affect the overall clustering quality.
Assumption of Equal Cluster Sizes and Variances: K-means assumes that clusters have equal sizes and variances. However, in real-world datasets, clusters may have varying sizes and shapes, violating these assumptions and leading to suboptimal results.
Handling Non-Globular Shapes: K-means struggles with detecting clusters that have non-globular or complex shapes. It tends to produce spherical or convex clusters, making it less suitable for datasets with irregularly shaped clusters.
Dependency on Distance Metric: K-means relies on the choice of distance metric, typically the Euclidean distance. If the data attributes have different scales or the underlying distribution is not Euclidean, the results may be biased. Using appropriate distance metrics or preprocessing techniques can help mitigate this limitation.
Lack of Robustness to Noise: K-means does not handle noisy data well. Noise points may be assigned to clusters or form their own clusters, leading to undesirable clustering outcomes.
Computationally Intensive for Large Datasets: As the number of data points increases, the computational complexity of K-means grows. It can become impractical for large datasets or high-dimensional data.
It's important to consider these limitations and choose alternative clustering algorithms or preprocessing techniques when these challenges arise in a particular problem domain.
How does K-means handle categorical or high-dimensional data?
K-means is primarily designed to handle continuous numerical data, and it may not be directly applicable to categorical or high-dimensional data. However, there are some common approaches to address these types of data:
Categorical Data: K-means algorithm relies on distance-based calculations, which are not well-defined for categorical variables. One common approach is to convert categorical variables into binary dummy variables. Each category is represented by a binary variable, indicating its presence or absence. Then, K-means can be applied to the transformed data. However, this approach may introduce some challenges, such as the curse of dimensionality or interpretation difficulties.
High-Dimensional Data: High-dimensional data can pose challenges for K-means, including increased computational complexity, the sparsity of data points, and the presence of irrelevant features. To handle high-dimensional data, dimensionality reduction techniques like Principal Component Analysis (PCA) or t-distributed Stochastic Neighbor Embedding (t-SNE) can be applied before applying K-means. These techniques reduce the dimensionality of the data while preserving important information.
Feature Selection: In the case of high-dimensional data, it is often beneficial to perform feature selection or feature extraction to reduce the number of features. By selecting or transforming the most relevant features, the quality of clustering results can be improved, and the impact of irrelevant or noisy features can be mitigated.
Advanced Clustering Algorithms: When dealing with categorical or high-dimensional data, alternative clustering algorithms may be more suitable than K-means. For categorical data, algorithms like k-modes or hierarchical clustering with appropriate distance measures can be used. For high-dimensional data, algorithms such as density-based clustering (DBSCAN) or Gaussian mixture models (GMM) can provide better results.
What are some techniques to improve the performance and robustness of K-means?
There are several techniques that can be employed to improve the performance and robustness of the K-means algorithm:
Data Preprocessing: Proper data preprocessing techniques can improve the performance of K-means. Some common preprocessing techniques include feature scaling or normalization to ensure that all features have similar scales, outlier detection and handling, and handling missing values appropriately.
Feature Selection or Dimensionality Reduction: If the dataset has high dimensionality or contains irrelevant or redundant features, performing feature selection or dimensionality reduction techniques can improve the performance of K-means. Techniques like Principal Component Analysis (PCA), Linear Discriminant Analysis (LDA), or t-distributed Stochastic Neighbor Embedding (t-SNE) can be applied to reduce the dimensionality of the data while preserving important information.
Initialization Strategies: K-means is sensitive to the initial placement of cluster centroids. Using more advanced initialization strategies can lead to better clustering results. For example, instead of random initialization, techniques like k-means++ initialization or initialization based on hierarchical clustering can be employed to improve the initialization quality.
Distance Metric Selection: The choice of distance metric can impact the performance of K-means. While the Euclidean distance is commonly used, it may not be suitable for all types of data. Depending on the data characteristics, selecting an appropriate distance metric, such as Manhattan distance or Mahalanobis distance, can lead to better clustering results.
Robustness to Outliers: Outliers can significantly affect the performance of K-means. Using outlier detection techniques and considering robust versions of K-means, such as the K-medians algorithm, which is less sensitive to outliers, can improve the robustness of the algorithm.
Iteration Termination Criteria: Setting appropriate iteration termination criteria can prevent unnecessary iterations and improve the efficiency of K-means. Termination criteria can be based on a maximum number of iterations, a threshold for the change in cluster assignments or centroids, or the stabilization of cluster assignments.
Evaluating Multiple Solutions: K-means can converge to different local optima depending on the initial centroids. Running the algorithm multiple times with different random initializations and selecting the solution with the lowest cost function value or highest silhouette score can help mitigate the sensitivity to initialization and improve the robustness of the algorithm.
By incorporating these techniques, the performance, stability, and robustness of the K-means algorithm can be enhanced, leading to better clustering results.
Are there any alternatives or variations of K-means that you are familiar with?
K-Means++: K-Means++ is an improvement over the random initialization in K-means. It uses a more sophisticated initialization strategy that selects initial cluster centroids with a higher probability of being far away from each other. This initialization technique often leads to faster convergence and better clustering results.
K-Medoids: K-Medoids, also known as Partitioning Around Medoids (PAM), is a variation of K-means that uses actual data points as cluster centroids (medoids) instead of the mean values. This makes K-Medoids more robust to outliers and noise, but it also increases the computational complexity compared to K-means.
Fuzzy C-Means (FCM): Fuzzy C-Means extends K-means by allowing data points to belong to multiple clusters with different degrees of membership. Instead of hard assignment, FCM assigns fuzzy membership values to data points, indicating the degree of belongingness to each cluster. FCM is useful when data points are not clearly separable into distinct clusters.
Hierarchical Clustering: Hierarchical clustering is an alternative approach that does not require specifying the number of clusters in advance. It builds a hierarchical tree-like structure of clusters, known as a dendrogram, by iteratively merging or splitting clusters based on the similarity or distance between data points. Agglomerative and divisive clustering are two common hierarchical clustering methods.
Density-Based Spatial Clustering of Applications with Noise (DBSCAN): DBSCAN is a density-based clustering algorithm that groups data points based on their density. It identifies dense regions separated by sparser regions and does not require the specification of the number of clusters. DBSCAN is effective in detecting clusters of arbitrary shapes and is robust to noise and outliers.
Mean Shift: Mean Shift is a non-parametric clustering algorithm that aims to locate the modes or high-density regions in the data. It iteratively shifts the centroid of a kernel density estimate towards the direction of higher density until convergence. Mean Shift is capable of identifying clusters with different shapes and sizes.
How do you evaluate the quality of the clustering results produced by K-means?
Sum of Squared Errors (SSE): SSE measures the total within-cluster variance by summing the squared Euclidean distances between each data point and its assigned cluster centroid. Lower SSE indicates better clustering, as it represents compact and well-separated clusters. However, SSE tends to favor solutions with more clusters.
Silhouette Coefficient: The Silhouette Coefficient measures the quality of clustering by considering both the cohesion (average distance to other points in the same cluster) and separation (average distance to points in the nearest neighboring cluster) of each data point. The Silhouette Coefficient ranges from -1 to 1, where values closer to 1 indicate well-separated and distinct clusters, values close to 0 indicate overlapping clusters, and values close to -1 indicate misclassified or poorly separated clusters. Higher Silhouette Coefficient indicates better clustering.
Calinski-Harabasz Index: The Calinski-Harabasz Index evaluates the ratio of between-cluster dispersion to within-cluster dispersion. It considers the sum of squared distances between cluster centroids and the overall centroid, normalized by the number of clusters and divided by the average within-cluster sum of squares. Higher Calinski-Harabasz Index values indicate better clustering.
Davies-Bouldin Index: The Davies-Bouldin Index measures the average similarity between clusters. It calculates the ratio of the within-cluster scatter to the between-cluster separation. Lower Davies-Bouldin Index values indicate better clustering, with values close to zero indicating well-separated clusters.
Rand Index (RI) and Adjusted Rand Index (ARI): Rand Index and Adjusted Rand Index measure the similarity between the clustering results and a reference clustering (if available). They calculate the percentage of agreements and disagreements between pairs of data points in terms of being assigned to the same or different clusters. Higher values indicate better agreement with the reference clustering.
Python Implement
K-means++
xxxxxxxxxx1import numpy as np2import matplotlib.pyplot as plt3from sklearn.datasets import load_iris4from sklearn.cluster import KMeans5from sklearn.metrics import silhouette_score6
7# Load the IRIS dataset8iris = load_iris()9X = iris.data10
11# Determine the optimal value of k using the elbow method12sse = []13silhouette_scores = []14k_values = range(2, 11)15
16for k in k_values:17    kmeans = KMeans(n_clusters=k, n_init=1, random_state=42)18    kmeans.fit(X)19    sse.append(kmeans.inertia_)20    silhouette_scores.append(silhouette_score(X, kmeans.labels_))21    22    23# kmeans++   24#for k in k_values:25#    kmeans = KMeans(n_clusters=k, init='k-means++', random_state=42)26#    kmeans.fit(X)27
28
29# Plot the elbow curve30plt.plot(k_values, sse, 'bo-')31plt.xlabel('Number of Clusters (k)')32plt.ylabel('Sum of Squared Errors (SSE)')33plt.title('Elbow Curve')34plt.show()35
36# Plot the silhouette scores37plt.plot(k_values, silhouette_scores, 'bo-')38plt.xlabel('Number of Clusters (k)')39plt.ylabel('Silhouette Score')40plt.title('Silhouette Scores')41plt.show()42
43# Choose the value of k based on the elbow curve and silhouette scores44chosen_k = 345
46# Apply K-means clustering with the chosen k value47kmeans = KMeans(n_clusters=chosen_k, random_state=42)48kmeans.fit(X)49
50# Get the cluster labels for each data point51labels = kmeans.labels_52
53# Plot the data points colored by cluster54plt.scatter(X[:, 0], X[:, 1], c=labels, cmap='viridis')55plt.xlabel('Sepal Length (cm)')56plt.ylabel('Sepal Width (cm)')57plt.title('K-means Clustering (k = {})'.format(chosen_k))58plt.show()


K-Medoids
x
1#### K-Medoids ####2
3import numpy as np4import matplotlib.pyplot as plt5from sklearn.datasets import load_iris6from pyclustering.cluster.kmedoids import kmedoids7from pyclustering.cluster import cluster_visualizer_multidim8
9# Load the IRIS dataset10iris = load_iris()11X = iris.data12
13# Convert the dataset to a list of lists14data = X.tolist()15
16# Determine the optimal value of k using the elbow method17sse = []18k_values = range(2, 11)19
20for k in k_values:21 # Create a K-Medoids instance22 kmedoids_instance = kmedoids(data, initial_index_medoids=np.random.choice(len(data), k, replace=False))23 24 # Run the K-Medoids algorithm25 kmedoids_instance.process()26
27 # Get the clusters and their medoids28 clusters = kmedoids_instance.get_clusters()29 medoids = kmedoids_instance.get_medoids()30 31 # Calculate the sum of squared errors (SSE)32 cluster_errors = []33 for cluster, medoid in zip(clusters, medoids):34 cluster_errors.append(sum(np.linalg.norm(np.array(data[i]) - np.array(data[medoid])) ** 2 for i in cluster))35 sse.append(sum(cluster_errors))36
37# Plot the elbow curve38plt.plot(k_values, sse, 'bo-')39plt.xlabel('Number of Clusters (k)')40plt.ylabel('Sum of Squared Errors (SSE)')41plt.title('Elbow Curve')42plt.show()43
44# Choose the value of k based on the elbow curve45chosen_k = 346
47# Run the K-Medoids algorithm with the chosen k value48kmedoids_instance = kmedoids(data, initial_index_medoids=np.random.choice(len(data), chosen_k, replace=False))49kmedoids_instance.process()50
51# Get the clusters and their medoids52clusters = kmedoids_instance.get_clusters()53medoids = kmedoids_instance.get_medoids()54
55# Visualize the clusters56visualizer = cluster_visualizer_multidim()57visualizer.append_clusters(clusters, data)58visualizer.show()59
DBSCAN
xxxxxxxxxx1341import numpy as np2import matplotlib.pyplot as plt3from sklearn.datasets import load_iris4from sklearn.cluster import DBSCAN5from sklearn.preprocessing import StandardScaler6
7# Load the IRIS dataset8iris = load_iris()9X = iris.data10
11# Standardize the features12scaler = StandardScaler()13X_scaled = scaler.fit_transform(X)14
15# Create a DBSCAN instance16dbscan = DBSCAN(eps=0.3, min_samples=5)17
18# Fit the model and predict clusters19clusters = dbscan.fit_predict(X_scaled)20
21# Number of clusters in labels, ignoring noise if present22n_clusters = len(set(clusters)) - (1 if -1 in clusters else 0)23n_noise = list(clusters).count(-1)24
25# Print the number of clusters and noise points26print('Estimated number of clusters:', n_clusters)27print('Estimated number of noise points:', n_noise)28
29# Plot the points with their assigned clusters30plt.scatter(X[:, 0], X[:, 1], c=clusters)31plt.xlabel('Sepal Length')32plt.ylabel('Sepal Width')33plt.title('DBSCAN Clustering')34plt.show()xxxxxxxxxx21Estimated number of clusters: 32Estimated number of noise points: 120

Hierarchical Clustering
xxxxxxxxxx1251import numpy as np2import matplotlib.pyplot as plt3from sklearn.datasets import load_iris4from sklearn.preprocessing import StandardScaler5from scipy.cluster.hierarchy import linkage, dendrogram6
7# Load the IRIS dataset8iris = load_iris()9X = iris.data10
11# Standardize the features12scaler = StandardScaler()13X_scaled = scaler.fit_transform(X)14
15# Perform hierarchical clustering16linkage_matrix = linkage(X_scaled, method='ward')17
18# Plot the dendrogram19plt.figure(figsize=(10, 6))20dendrogram(linkage_matrix, p=150, truncate_mode='level', color_threshold=4)21plt.xlabel('Data Points')22plt.ylabel('Distance')23plt.title('Hierarchical Clustering Dendrogram')24plt.show()
Fuzzy C-Means
xxxxxxxxxx1761import numpy as np2import matplotlib.pyplot as plt3from sklearn.datasets import load_breast_cancer4from sklearn.decomposition import PCA5from sklearn.preprocessing import StandardScaler6from sklearn.metrics import pairwise_distances7from sklearn.metrics import pairwise_distances_argmin_min8
9
10def initialize_membership_matrix(n_samples, n_clusters):11    return np.random.rand(n_samples, n_clusters)12
13
14def update_cluster_centers(X, membership_matrix, m):15    um = membership_matrix ** m16    cluster_centers = um.T.dot(X) / um.sum(axis=0, keepdims=True).T17    return cluster_centers18
19
20def update_membership_matrix(X, cluster_centers, m):21    distances = pairwise_distances(X, cluster_centers)22    membership_matrix = 1 / distances**(2 / (m - 1))23    membership_matrix /= membership_matrix.sum(axis=1, keepdims=True)24    return membership_matrix25
26
27def fuzzy_c_means(X, n_clusters, m, max_iters=100):28    n_samples = X.shape[0]29
30    # Initialize membership matrix randomly31    membership_matrix = initialize_membership_matrix(n_samples, n_clusters)32
33    for _ in range(max_iters):34        # Update cluster centers35        cluster_centers = update_cluster_centers(X, membership_matrix, m)36
37        # Update membership matrix38        new_membership_matrix = update_membership_matrix(X, cluster_centers, m)39
40        # Check convergence41        if np.linalg.norm(new_membership_matrix - membership_matrix) < 1e-6:42            break43
44        membership_matrix = new_membership_matrix45
46    return cluster_centers, membership_matrix47
48
49# Load the Breast Cancer dataset50breast_cancer = load_breast_cancer()51X = breast_cancer.data52
53# Standardize the features54scaler = StandardScaler()55X_scaled = scaler.fit_transform(X)56
57# Apply PCA for visualization purposes (reduce to 2 dimensions)58pca = PCA(n_components=2)59X_pca = pca.fit_transform(X_scaled)60
61# Perform Fuzzy C-Means clustering62n_clusters = 263m = 264cluster_centers, membership_matrix = fuzzy_c_means(X_scaled, n_clusters, m)65
66# Assign each sample to the cluster with the highest membership value67labels = pairwise_distances_argmin_min(X_scaled, cluster_centers)[0]68
69# Plot the clustered data points70plt.scatter(X_pca[:, 0], X_pca[:, 1], c=labels, cmap='viridis')71plt.scatter(cluster_centers[:, 0], cluster_centers[:, 1], marker='X', c='red', s=200)72plt.xlabel('Component 1')73plt.ylabel('Component 2')74plt.title('Fuzzy C-Means Clustering')75plt.show()