Logistic Regression
Logistic RegressionKey takeawaysInterview QuestionsSolutionsWhat is the difference between logistic regression and linear regression?How does logistic regression handle multi-class classification problems?What are the assumptions of logistic regression?How does logistic regression handle missing values?How is multicollinearity treated in logistic regression?What is the loss function used in logistic regression? How is it minimized?How does logistic regression handle imbalanced datasets?How do you choose the regularization parameter in logistic regression?Can logistic regression handle non-linear relationships? If so, how?What are the differences between logistic regression and support vector machines (SVM)?What are the differences between logistic regression and decision trees?What are the advantages and limitations of logistic regression?What do the weights and biases represent in logistic regression?How does logistic regression handle outliers?What methods can be used for feature selection in logistic regression?How do you evaluate the performance of a logistic regression model?How does logistic regression handle high-dimensional datasets?Is logistic regression sensitive to outliers?In which domains is logistic regression commonly applied?How do you deal with multicollinearity in logistic regression?Python ApplicationUsing SklearnFrom ScratchNotationsSigmoid or Logistic functionHypothesisLoss/Cost functionGradient DescentDecision boundaryNormalize FunctionTrain FunctionPredict FunctionTraining and Plotting Decision BoundaryCalculating AccuracyTesting on Non-linearly Separable DataImportant Insights
Key takeaways
Logistic regression is commonly used for binary classification problems, where it predicts the probability of an input belonging to a specific class.
Logistic regression uses the sigmoid function (or logistic function) to map the linear combination of features into a probability value.
The model is trained using maximum likelihood estimation, where the goal is to maximize the likelihood function to fit the model parameters.
Logistic regression assumes a linear relationship between the features and the output and assumes independence among the features.
Model parameters can be estimated using optimization algorithms like gradient descent, which minimizes a loss function (typically the log loss).
Logistic regression models can output class labels (based on a probability threshold), predicted probabilities, or decision boundaries.
Feature engineering plays a crucial role in logistic regression, including feature selection, feature scaling, and feature interactions.
Polynomial logistic regression can handle non-linear relationships by introducing polynomial features to increase the model's expressive power.
Evaluation metrics for logistic regression include accuracy, precision, recall, F1 score, among others, depending on the specific problem and requirements.
Logistic regression is a simple and efficient classification algorithm that performs well on linearly separable problems and finds applications in various domains such as healthcare, finance, natural language processing, and more.
Interview Questions
What is the difference between logistic regression and linear regression?
How does logistic regression handle multi-class classification problems?
What are the assumptions of logistic regression?
How does logistic regression handle missing values?
How is multicollinearity treated in logistic regression?
What is the loss function used in logistic regression? How is it minimized?
How does logistic regression handle imbalanced datasets?
How do you choose the regularization parameter in logistic regression?
Can logistic regression handle non-linear relationships? If so, how?
What are the differences between logistic regression and support vector machines (SVM)?
What are the differences between logistic regression and decision trees?
What are the advantages and limitations of logistic regression?
What do the weights and biases represent in logistic regression?
How does logistic regression handle outliers?
What methods can be used for feature selection in logistic regression?
How do you evaluate the performance of a logistic regression model?
How does logistic regression handle high-dimensional datasets?
Is logistic regression sensitive to outliers?
In which domains is logistic regression commonly applied?
How do you deal with multicollinearity in logistic regression?
Solutions
What is the difference between logistic regression and linear regression?
The main difference is in the type of output they predict. Linear regression is used for predicting continuous numerical values, while logistic regression is used for predicting discrete categorical values or probabilities.
Linear regression uses a linear function to model the relationship between the features and the output, while logistic regression uses the sigmoid function to model the probability of belonging to a specific class.
The predicted values in linear regression can be any real number, while the predicted values in logistic regression are probabilities between 0 and 1, representing class membership probabilities.
How does logistic regression handle multi-class classification problems?
Logistic regression can handle multi-class classification problems through two common strategies:
One-vs-Rest (OvR) or One-vs-All: Train multiple binary logistic regression models, where each model distinguishes one class from the rest. During inference, the class with the highest probability is selected as the final prediction.
One-vs-One (OvO): Train binary logistic regression models for each pair of classes. During inference, each model predicts the probability of a specific class pair, and a voting or decision rule is used to determine the final class.
What are the assumptions of logistic regression?
The assumptions of logistic regression include:
Linearity: There is a linear relationship between the features and the log odds of the output.
Independence of errors: The errors/residuals should be independent of each other.
Absence of multicollinearity: The features should not be highly correlated with each other.
No outliers: The data should not contain extreme outliers that significantly affect the model.
Large sample size: Logistic regression performs well with a sufficient number of observations.
How does logistic regression handle missing values?
Logistic regression can handle missing values through various approaches:
Complete case analysis: Simply remove the samples with missing values if the missingness is minimal.
Mean imputation: Replace the missing values with the mean value of the corresponding feature.
Model-based imputation: Use other features to build a regression model and predict the missing values.
Multiple imputation: Generate multiple imputed datasets by estimating missing values multiple times and analyze them collectively.
How is multicollinearity treated in logistic regression?
Multicollinearity refers to high correlation among the predictor variables. To address multicollinearity in logistic regression, you can consider the following approaches:
Feature selection: Remove one of the highly correlated variables to reduce redundancy.
Dimensionality reduction: Use techniques like principal component analysis (PCA) to transform the original correlated variables into a smaller set of uncorrelated variables.
Ridge regression: Introduce a penalty term to the logistic regression objective function to reduce the impact of multicollinearity.
Domain knowledge: Utilize domain knowledge to decide which variables to keep or combine correlated variables into composite variables.
What is the loss function used in logistic regression? How is it minimized?
The loss function used in logistic regression is called the "logistic loss" or "cross-entropy loss." It measures the difference between the predicted probabilities and the actual class labels.
The logistic loss function is minimized using optimization algorithms such as gradient descent or Newton's method. The goal is to find the set of model parameters that minimizes the overall loss across the training data.
How does logistic regression handle imbalanced datasets?
Logistic regression can handle imbalanced datasets through various techniques:
Class weighting: Assign higher weights to the minority class to give it more importance during model training.
Oversampling: Increase the number of instances in the minority class through techniques like SMOTE (Synthetic Minority Over-sampling Technique).
Undersampling: Decrease the number of instances in the majority class to achieve a more balanced dataset.
Cost-sensitive learning: Assign different misclassification costs for different classes to address the class imbalance.
How do you choose the regularization parameter in logistic regression?
The regularization parameter in logistic regression controls the trade-off between model complexity and overfitting. It can be chosen through techniques like:
Cross-validation: Evaluate the performance of the logistic regression model with different regularization parameters using cross-validation, and select the parameter that yields the best performance.
Grid search: Define a range of possible regularization parameter values and evaluate the model's performance for each value in the grid to find the optimal parameter.
Can logistic regression handle non-linear relationships? If so, how?
Logistic regression can handle non-linear relationships between the features and the output by using techniques such as:
Polynomial features: Transform the original features into polynomial features (e.g., by squaring or cubing) and include them in the logistic regression model.
Interaction terms: Create new features by multiplying or interacting the existing features, allowing the model to capture non-linear interactions.
Basis functions: Transform the original features using non-linear functions such as sigmoid, exponential, or Gaussian functions.
What are the differences between logistic regression and support vector machines (SVM)?
Logistic regression and support vector machines (SVM) are both popular classification algorithms, but they have some differences:
Decision boundary: Logistic regression directly models the probability of belonging to a class, while SVM aims to find a decision boundary that maximally separates different classes.
Loss function: Logistic regression uses the logistic loss function, while SVM uses the hinge loss function.
Complexity: Logistic regression is simpler and interpretable, while SVM can handle non-linear relationships using the kernel trick and is effective in high-dimensional spaces.
Handling outliers: SVM is more robust to outliers due to the use of the hinge loss function, while logistic regression can be influenced by outliers.
Multi-class classification: Logistic regression can handle multi-class classification using strategies like one-vs-rest or one-vs-one, while SVM originally supports binary classification but can be extended to multi-class classification using techniques like one-vs-one or one-vs-rest.
What are the differences between logistic regression and decision trees?
Logistic regression is a linear model that models the relationship between features and probabilities, while decision trees are non-linear models that make predictions by partitioning the feature space into regions.
Logistic regression predicts probabilities or class membership probabilities, while decision trees directly predict class labels.
Logistic regression is a parametric model, while decision trees are non-parametric models.
Logistic regression is prone to underfitting if the relationship between features and output is complex, while decision trees can capture non-linear relationships easily.
Logistic regression provides interpretable coefficients that indicate the impact of features on the output, while decision trees provide decision rules based on feature thresholds.
What are the advantages and limitations of logistic regression?
Advantages:
Simplicity and interpretability.
Efficient training and prediction.
Provides probabilities as output.
Handles both binary and multi-class classification.
Can handle high-dimensional data.
Limitations:
Assumes a linear relationship between features and output.
Sensitive to outliers.
May suffer from overfitting if the number of features is large compared to the number of samples.
Cannot capture complex non-linear relationships without feature engineering.
What do the weights and biases represent in logistic regression?
In logistic regression, weights (coefficients) represent the strength and direction of the relationship between each feature and the output. They indicate how much each feature contributes to the log-odds of belonging to a certain class. Biases (intercepts) represent the baseline log-odds when all features are zero.
How does logistic regression handle outliers?
Logistic regression can be sensitive to outliers because it uses the logistic loss function. Outliers can significantly influence the model's parameter estimates. To handle outliers, you can consider the following approaches:
Removing outliers: Remove extreme outliers from the dataset if they are due to data entry errors or other anomalies.
Robust methods: Use robust versions of logistic regression, such as penalized logistic regression (e.g., L1 or L2 regularization) that can reduce the impact of outliers.
Winsorization: Cap or truncate extreme values to reduce their influence on the model.
What methods can be used for feature selection in logistic regression?
Feature selection methods in logistic regression include:
Univariate selection: Select features based on their individual statistical significance or correlation with the output using methods like chi-square test, ANOVA, or correlation coefficients.
Recursive feature elimination: Recursively eliminate less important features based on their weights or importance scores obtained from the logistic regression model.
Regularization: Use regularization techniques (e.g., L1 or L2 regularization) to encourage sparsity in the coefficient estimates and automatically perform feature selection.
Stepwise selection: Iteratively add or remove features based on their statistical significance or model fit criteria (e.g., forward selection, backward elimination, or stepwise regression).
Domain knowledge: Utilize domain expertise to select relevant features based on prior knowledge of the problem domain.
How do you evaluate the performance of a logistic regression model?
The performance of a logistic regression model can be evaluated using various metrics, including:
Accuracy: The proportion of correctly classified instances.
Precision: The proportion of true positives among the instances predicted as positive.
Recall (Sensitivity): The proportion of true positives correctly identified.
Specificity: The proportion of true negatives correctly identified.
F1 score: The harmonic mean of precision and recall, which balances both metrics.
Receiver Operating Characteristic (ROC) curve: Plots the true positive rate against the false positive rate, allowing the selection of an appropriate classification threshold.
Area Under the ROC Curve (AUC): Measures the overall performance of the model, regardless of the classification threshold.
How does logistic regression handle high-dimensional datasets?
Logistic regression can handle high-dimensional datasets through techniques such as:
Regularization: Use regularization techniques like L1 (Lasso) or L2 (Ridge) regularization to shrink the coefficients of less important features towards zero, reducing model complexity.
Feature selection: Select relevant features based on their statistical significance, correlation with the output, or importance scores derived from the model.
Dimensionality reduction: Apply techniques like principal component analysis (PCA) or feature extraction methods to transform the original high-dimensional features into a lower-dimensional space.
Is logistic regression sensitive to outliers?
Logistic regression can be sensitive to outliers because it uses the logistic loss function. Outliers with extreme values can heavily influence the model's parameter estimates and may result in biased predictions. Preprocessing techniques such as winsorization or robust methods like penalized logistic regression can help mitigate the impact of outliers.
In which domains is logistic regression commonly applied?
Logistic regression is commonly applied in various domains, including:
Healthcare: Predicting disease risk, prognosis, or treatment outcomes.
Marketing: Predicting customer churn, response to marketing campaigns, or customer segmentation.
Finance: Credit scoring, fraud detection, or predicting default probabilities.
Social sciences: Analyzing survey data, predicting voting behavior, or studying social phenomena.
Natural language processing: Text classification, sentiment analysis, or spam detection.
Image recognition: Object recognition or medical image analysis (e.g., tumor detection).
How do you deal with multicollinearity in logistic regression?
Multicollinearity refers to high correlation among predictor variables in logistic regression. Techniques to deal with multicollinearity include:
Feature selection: Remove one of the highly correlated variables to reduce redundancy.
Dimensionality reduction: Use techniques like PCA to transform the original correlated variables into a smaller set of uncorrelated variables.
Ridge regression: Introduce a penalty term to the logistic regression objective function to reduce the impact of multicollinearity.
Variance Inflation Factor (VIF): Calculate the VIF for each variable and remove variables with high VIF values, indicating high multicollinearity.
Domain knowledge: Utilize domain expertise to decide which variables to keep or combine correlated variables into composite variables.
Python Application
Using Sklearn
x261from sklearn.datasets import load_iris2from sklearn.linear_model import LogisticRegression3from sklearn.model_selection import train_test_split4from sklearn.metrics import accuracy_score5
6# Load the Iris dataset7iris = load_iris()8X = iris.data9y = iris.target10
11# Split the data into training and testing sets12X_train, X_test, y_train, y_test = train_test_split(X, y, test_size=0.2, random_state=42)13
14# Create an instance of the LogisticRegression model15logreg = LogisticRegression()16
17# Train the model on the training data18logreg.fit(X_train, y_train)19
20# Make predictions on the testing data21y_pred = logreg.predict(X_test)22
23# Evaluate the accuracy of the model24accuracy = accuracy_score(y_test, y_pred)25print("Accuracy:", accuracy)In this example, we first import the necessary modules: load_iris to load the Iris dataset, LogisticRegression for logistic regression implementation, train_test_split for splitting the data into training and testing sets, and accuracy_score for evaluating the accuracy of the model.
We then load the Iris dataset using load_iris() and assign the feature matrix to X and the target variable to y. Next, we split the data into training and testing sets using train_test_split.
After that, we create an instance of the LogisticRegression model using LogisticRegression(). We train the model on the training data using the fit method. Then, we use the trained model to make predictions on the testing data with the predict method.
Finally, we evaluate the accuracy of the model by comparing the predicted labels (y_pred) with the actual labels (y_test) using the accuracy_score function. The accuracy of the model is printed to the console.
From Scratch
Notations
n→number of featuresm→number of training examplesX→input data matrix of shape (mxn)y→true/ target value (can be 0 or 1 only)x(i), y(i)→ith training examplew→ weights (parameters) of shape (nx 1)b→bias (parameter), a real number that can be broadcasted.y_hat(y with a cap/hat)→ hypothesis (outputs values between 0 and 1)
We are going to do binary classification, so the value of y (true/target) is going to be either 0 or 1.
For example, suppose we have a breast cancer dataset with X being the tumor size and y being whether the lump is malignant(cancerous) or benign(non-cancerous). Whenever a patient visits, your job is to tell him/her whether the lump is malignant(0) or benign(1) given the size of the tumor. There are only two classes in this case.
So, y is going to be either 0 or 1.
Let’s use the following randomly generated data as a motivating example to understand Logistic Regression.
31from sklearn.datasets import make_classificationX, y = make_classification(n_features=2, n_redundant=0, 2 n_informative=2, random_state=1, 3 n_clusters_per_class=1)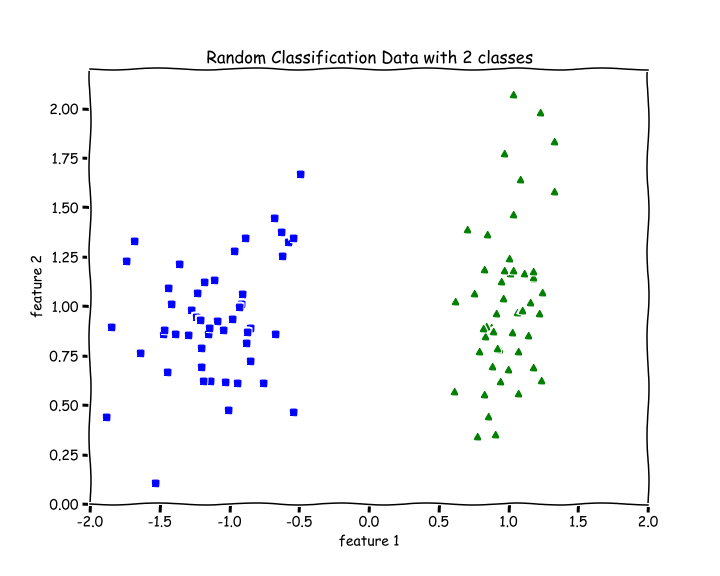
There are 2 features, n=2. There are 2 classes, blue and green.
For a binary classification problem, we naturally want our hypothesis (y_hat) function to output values between 0 and 1 which means all Real numbers from 0 to 1.
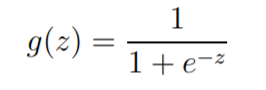
So, we want to choose a function that squishes all its inputs between 0 and 1. One such function is the Sigmoid or Logistic function.
Sigmoid or Logistic function
The Sigmoid Function squishes all its inputs (values on the x-axis) between 0 and 1 as we can see on the y-axis in the graph below.
The range of inputs for this function is the set of all Real Numbers and the range of outputs is between 0 and 1.
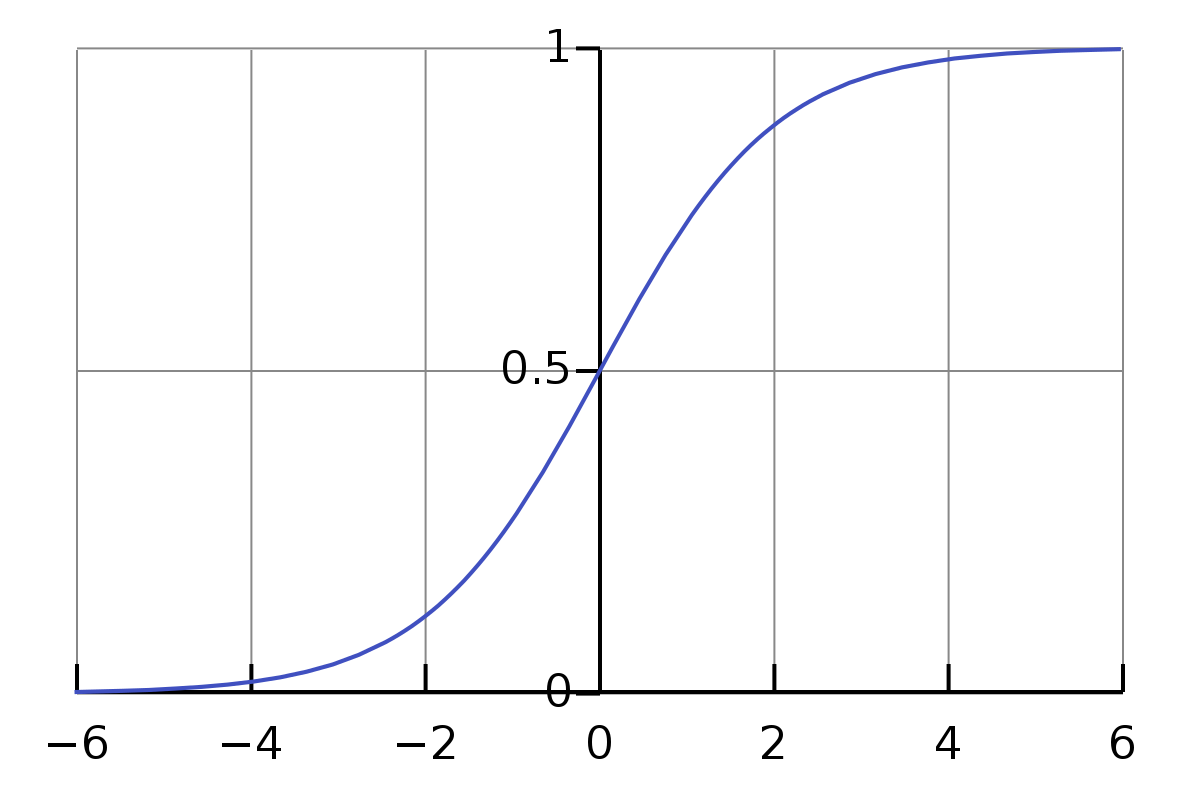
We can see that as z increases towards positive infinity the output gets closer to 1, and as z decreases towards negative infinity the output gets closer to 0.
21def sigmoid(z):2 return 1.0/(1 + np.exp(-z))Hypothesis
For Linear Regression, we had the hypothesis
Now, for Logistic Regression our hypothesis is — y_hat = sigmoid(w.X + b) , whose output range is between 0 and 1 because by applying a sigmoid function, we always output a number between 0 and 1.
y_hat =
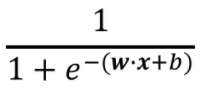
Hypothesis for Logistic Regression; source
z = w.X +b
Now, you might wonder that there are lots of continuous function that outputs values between 0 and 1. Why did we choose the Logistic Function only, why not any other? Actually, there is a broader class of algorithms called Generalized Linear Models of which this is a special case. Sigmoid function falls out very naturally from it given our set of assumptions.
Loss/Cost function
For every parametric machine learning algorithm, we need a loss function, which we want to minimize (find the global minimum of) to determine the optimal parameters(w and b) which will help us make the best predictions.
For Linear Regression, we had the mean squared error as the loss function. But that was a regression problem.
For a binary classification problem, we need to be able to output the probability of y being 1(tumor is benign for example), then we can determine the probability of y being 0(tumor is malignant) or vice versa.
So, we assume that the values that our hypothesis(y_hat) outputs between 0 and 1, is a probability of y being 1, then the probability of y being 0 will be (1-y_hat) .
Remember that
yis only 0 or 1.y_hatis a number between 0 and 1.
More formally, the probability of y=1 given X , parameterized by w and b is y_hat (hypothesis). Then, logically the probability of y=0 given X , parameterized by w and b should be 1-y_hat . This can be written as —
P(y = 1 | X; w, b) =y_hat
Then, based on our assumptions, we can calculate the loglikelihood of parameters using the above two equations and consequently determine the loss function which we have to minimize. The following is the Binary Coss-Entropy Loss or the Log Loss function —
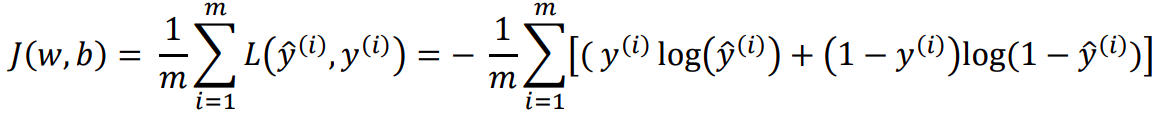
J(w,b) is the overall cost/loss of the training set and L is the cost for ith training example.
xxxxxxxxxx31def loss(y, y_hat):2loss = -np.mean(y*(np.log(y_hat)) - (1-y)*np.log(1-y_hat))3return loss
By looking at the Loss function, we can see that loss approaches 0 when we predict correctly, i.e, when y=0 and y_hat=0 or, y=1 and y_hat=1, and loss function approaches infinity if we predict incorrectly, i.e, when y=0 but y_hat=1 or, y=1 but y_hat=1.
Gradient Descent
Now that we know our hypothesis function and the loss function, all we need to do is use the Gradient Descent Algorithm to find the optimal values of our parameters like this(lr →learning rate) —
w := w-lr*dw
b := b-lr*db
where, dw is the partial derivative of the Loss function with respect to w and db is the partial derivative of the Loss function with respect to b .
dw = (1/m)*(y_hat — y).X
db = (1/m)*(y_hat — y)
Let’s write a function gradients to calculate dw and db .
See comments(#).
181def gradients(X, y, y_hat):2 3 # X --> Input.4 # y --> true/target value.5 # y_hat --> hypothesis/predictions.6 # w --> weights (parameter).7 # b --> bias (parameter).8 9 # m-> number of training examples.10 m = X.shape[0]11 12 # Gradient of loss w.r.t weights.13 dw = (1/m)*np.dot(X.T, (y_hat - y))14 15 # Gradient of loss w.r.t bias.16 db = (1/m)*np.sum((y_hat - y)) 17 18 return dw, dbDecision boundary
Now, we want to know how our hypothesis(y_hat) is going to make predictions of whether y=1 or y=0. The way we defined hypothesis is the probability of y being 1 given X and parameterized by w and b .
So, we will say that it will make a prediction of —
y=1 when
y_hat ≥ 0.5y=0 when
y_hat < 0.5
Looking at the graph of the sigmoid function, we see that for —
y_hat ≥ 0.5,
zor w.X + b ≥ 0y_hat < 0.5, z or w.X + b < 0
which means, we make a prediction for —
y=1 when w.X + b ≥ 0
y=0 when w.X + b < 0
So, **w.X + b = 0** is going to be our Decision boundary.
The following code for plotting the Decision Boundary only works when we have only two features in
X.
231def plot_decision_boundary(X, w, b):2 3 # X --> Inputs4 # w --> weights5 # b --> bias6 7 # The Line is y=mx+c8 # So, Equate mx+c = w.X + b9 # Solving we find m and c10 x1 = [min(X[:,0]), max(X[:,0])]11 m = -w[0]/w[1]12 c = -b/w[1]13 x2 = m*x1 + c14 15 # Plotting16 fig = plt.figure(figsize=(10,8))17 plt.plot(X[:, 0][y==0], X[:, 1][y==0], "g^")18 plt.plot(X[:, 0][y==1], X[:, 1][y==1], "bs")19 plt.xlim([-2, 2])20 plt.ylim([0, 2.2])21 plt.xlabel("feature 1")22 plt.ylabel("feature 2")23 plt.title('Decision Boundary') plt.plot(x1, x2, 'y-')Normalize Function
Function to normalize the inputs. See comments(#).
131def normalize(X):2 3 # X --> Input.4 5 # m-> number of training examples6 # n-> number of features 7 m, n = X.shape8 9 # Normalizing all the n features of X.10 for i in range(n):11 X = (X - X.mean(axis=0))/X.std(axis=0)12 13 return XTrain Function
The train the function includes initializing the weights and bias and the training loop with mini-batch gradient descent.
See comments(#).
511def train(X, y, bs, epochs, lr):2 3 # X --> Input.4 # y --> true/target value.5 # bs --> Batch Size.6 # epochs --> Number of iterations.7 # lr --> Learning rate.8 9 # m-> number of training examples10 # n-> number of features 11 m, n = X.shape12 13 # Initializing weights and bias to zeros.14 w = np.zeros((n,1))15 b = 016 17 # Reshaping y.18 y = y.reshape(m,1)19 20 # Normalizing the inputs.21 x = normalize(X)22 23 # Empty list to store losses.24 losses = []25 26 # Training loop.27 for epoch in range(epochs):28 for i in range((m-1)//bs + 1):29 30 # Defining batches. SGD.31 start_i = i*bs32 end_i = start_i + bs33 xb = X[start_i:end_i]34 yb = y[start_i:end_i]35 36 # Calculating hypothesis/prediction.37 y_hat = sigmoid(np.dot(xb, w) + b)38 39 # Getting the gradients of loss w.r.t parameters.40 dw, db = gradients(xb, yb, y_hat)41 42 # Updating the parameters.43 w -= lr*dw44 b -= lr*db45 46 # Calculating loss and appending it in the list.47 l = loss(y, sigmoid(np.dot(X, w) + b))48 losses.append(l)49 50 # returning weights, bias and losses(List).51 return w, b, lossesPredict Function
See comments(#).
161def predict(X):2 3 # X --> Input.4 5 # Normalizing the inputs.6 x = normalize(X)7 8 # Calculating presictions/y_hat.9 preds = sigmoid(np.dot(X, w) + b)10 11 # Empty List to store predictions.12 pred_class = [] # if y_hat >= 0.5 --> round up to 113 # if y_hat < 0.5 --> round up to 114 pred_class = [1 if i > 0.5 else 0 for i in preds]15 16 return np.array(pred_class)Training and Plotting Decision Boundary
31# Training 2w, b, l = train(X, y, bs=100, epochs=1000, lr=0.01)# Plotting Decision Boundary3plot_decision_boundary(X, w, b)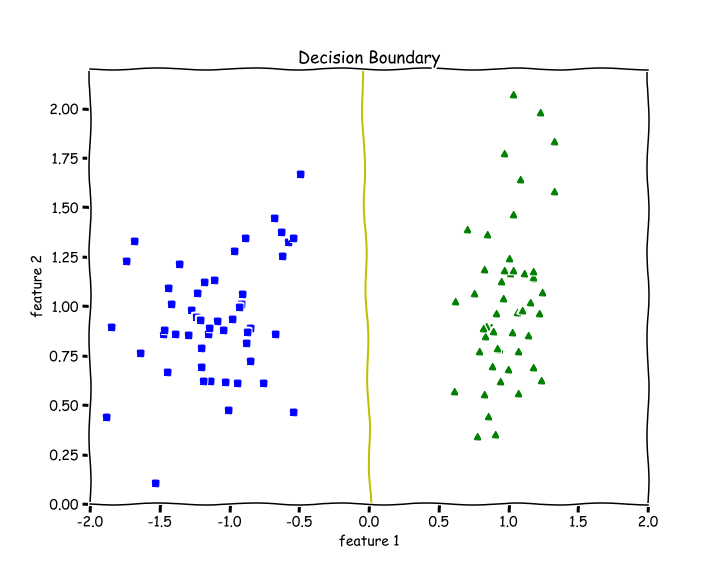
Calculating Accuracy
We check how many examples did we get right and divide it by the total number of examples.
41def accuracy(y, y_hat):2 accuracy = np.sum(y == y_hat) / len(y)3 return accuracyaccuracy(X, y_hat=predict(X))4>> 1.0We get an accuracy of 100%. We can see from the above decision boundary graph that we are able to separate the green and blue classes perfectly.
Testing on Non-linearly Separable Data
Let’s test out our code for data that is not linearly separable.
11from sklearn.datasets import make_moonsX, y = make_moons(n_samples=100, noise=0.24)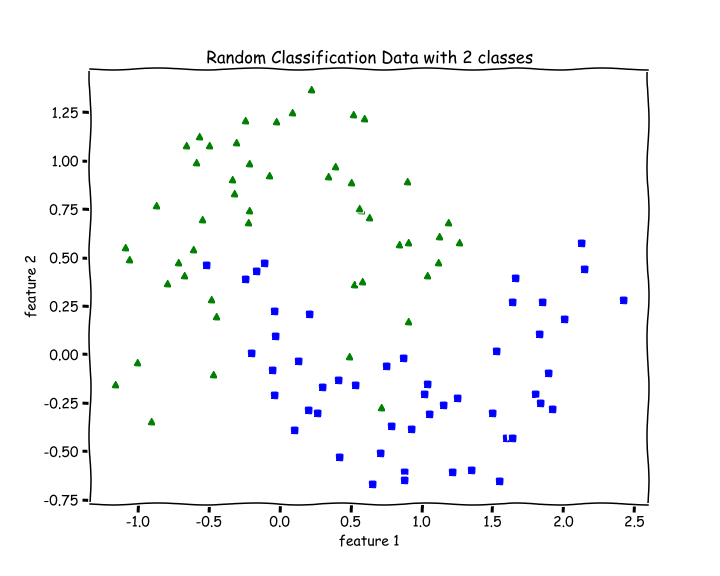
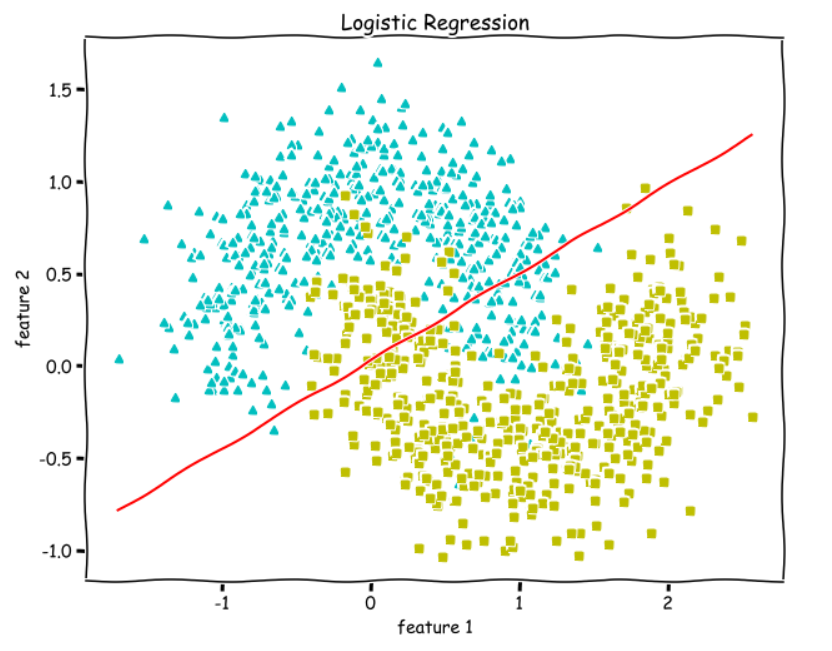
31# Training 2w, b, l = train(X, y, bs=100, epochs=1000, lr=0.01)# Plotting Decision Boundary3plot_decision_boundary(X, w, b)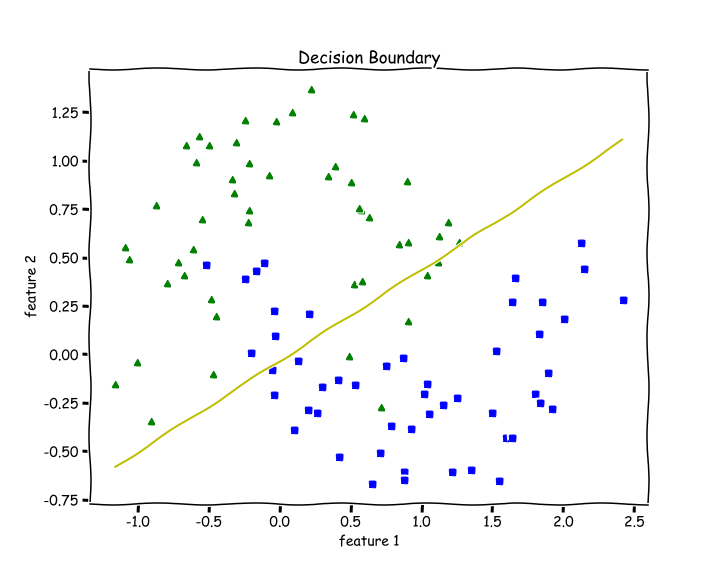
Since Logistic Regression is only a linear classifier, we were able to put a decent straight line which was able to separate as many blues and greens from each other as possible.
Let’s check accuracy for this —
21accuracy(y, predict(X))2>> 0.8787 % accuracy. Not bad.
Important Insights
When I was training the data using my code, I always got the NaN values in my losses list.
Later I discovered the I was not normalizing my inputs, and that was the reason my losses were full of NaNs.
If you are getting NaN values or overflow during training —
Normalize your Data —
X.Lower your Learning rate.